Formulation Tool for Aquafeed Manufacturers
Quick Overview
| What is it? | A tool to perform least cost feed formulations for major farmed species in different countries |
|---|---|
| Target Audience | Feed formulators, Feed Manufacturers, Feed Ingredient Manufacturers |
| Who worked with me? | 2 Developers + 2 Aquaculture Scientists |
| Interesting stuff I worked in | User Personas, User Journeys, Data Visualization, B2B applications |
We have been developing a suite of tools that are used by Aquafeed manufacturers to track their feed ingredients, formulate feed, and price them according to their nutritional value. This design document will cover one of these tools: The Feed Formulation Tool.
The Feed Formulation Tool (FFT) is designed to generate least-cost feed formulations for over 30 species, find production volume estimates for 15 countries leading in aquaculture, and to run market sizing analysis to compare your feed ingredient against other ingredients in generating a typical feed formulation.
The Users
The target audience for this particular toolset are personnel from feed manufacturing and feed ingredient manufacturing companies. Before this tool was introduced, feed formulations were mostly done using competing software or manually using spreadsheets.
One of the major challenges we faced was to determine where some information needed to be displayed, especially the nutritional information about feed ingredients. Some users preferred to edit these values, while we only needed to display these information to the others for the sake of transparency. For the second type of users, having to scroll, or even click through this information was cumbersome and added no value to their experience.
Thus, we created the following user personas.
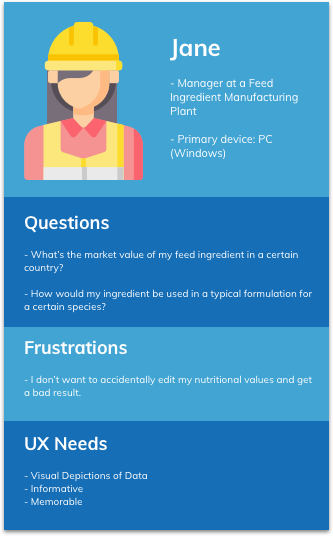
- Jane: This user wants to add their custom ingredient to the formulation and see how that ingredient can be used in a feed formulation, and its sale potential.
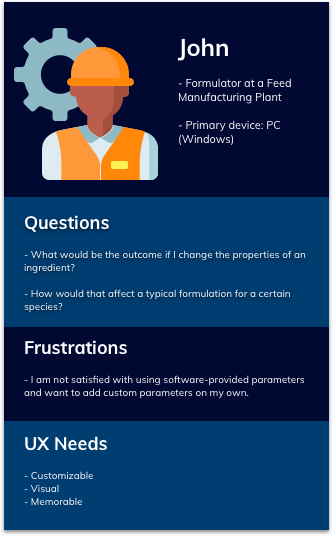
- John: This user wants to change feed ingredient values, nutrient values, group constraint values, as well as add ingredients from various places and add custom nutrients. They will then generate a formulation based on this simulation. They might tweak the values back and forth for better results. Customizability is the key for them.
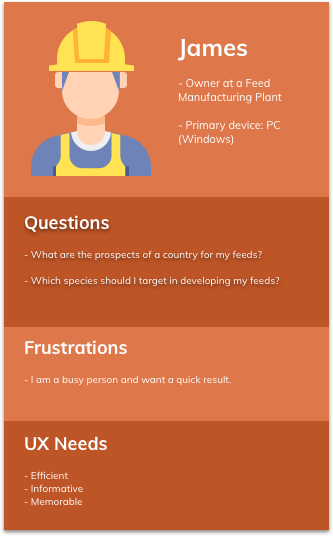
- James: This user wants to see the total Aquaculture feed production per species of a specific country. This will then enable them to decide what species they should focus on in that specific country. They don’t typically care about the feed formulation and the ingredient specifications behind these formulations, but they would appreciate having them somewhere if they want to take a closer look.
The User Journeys
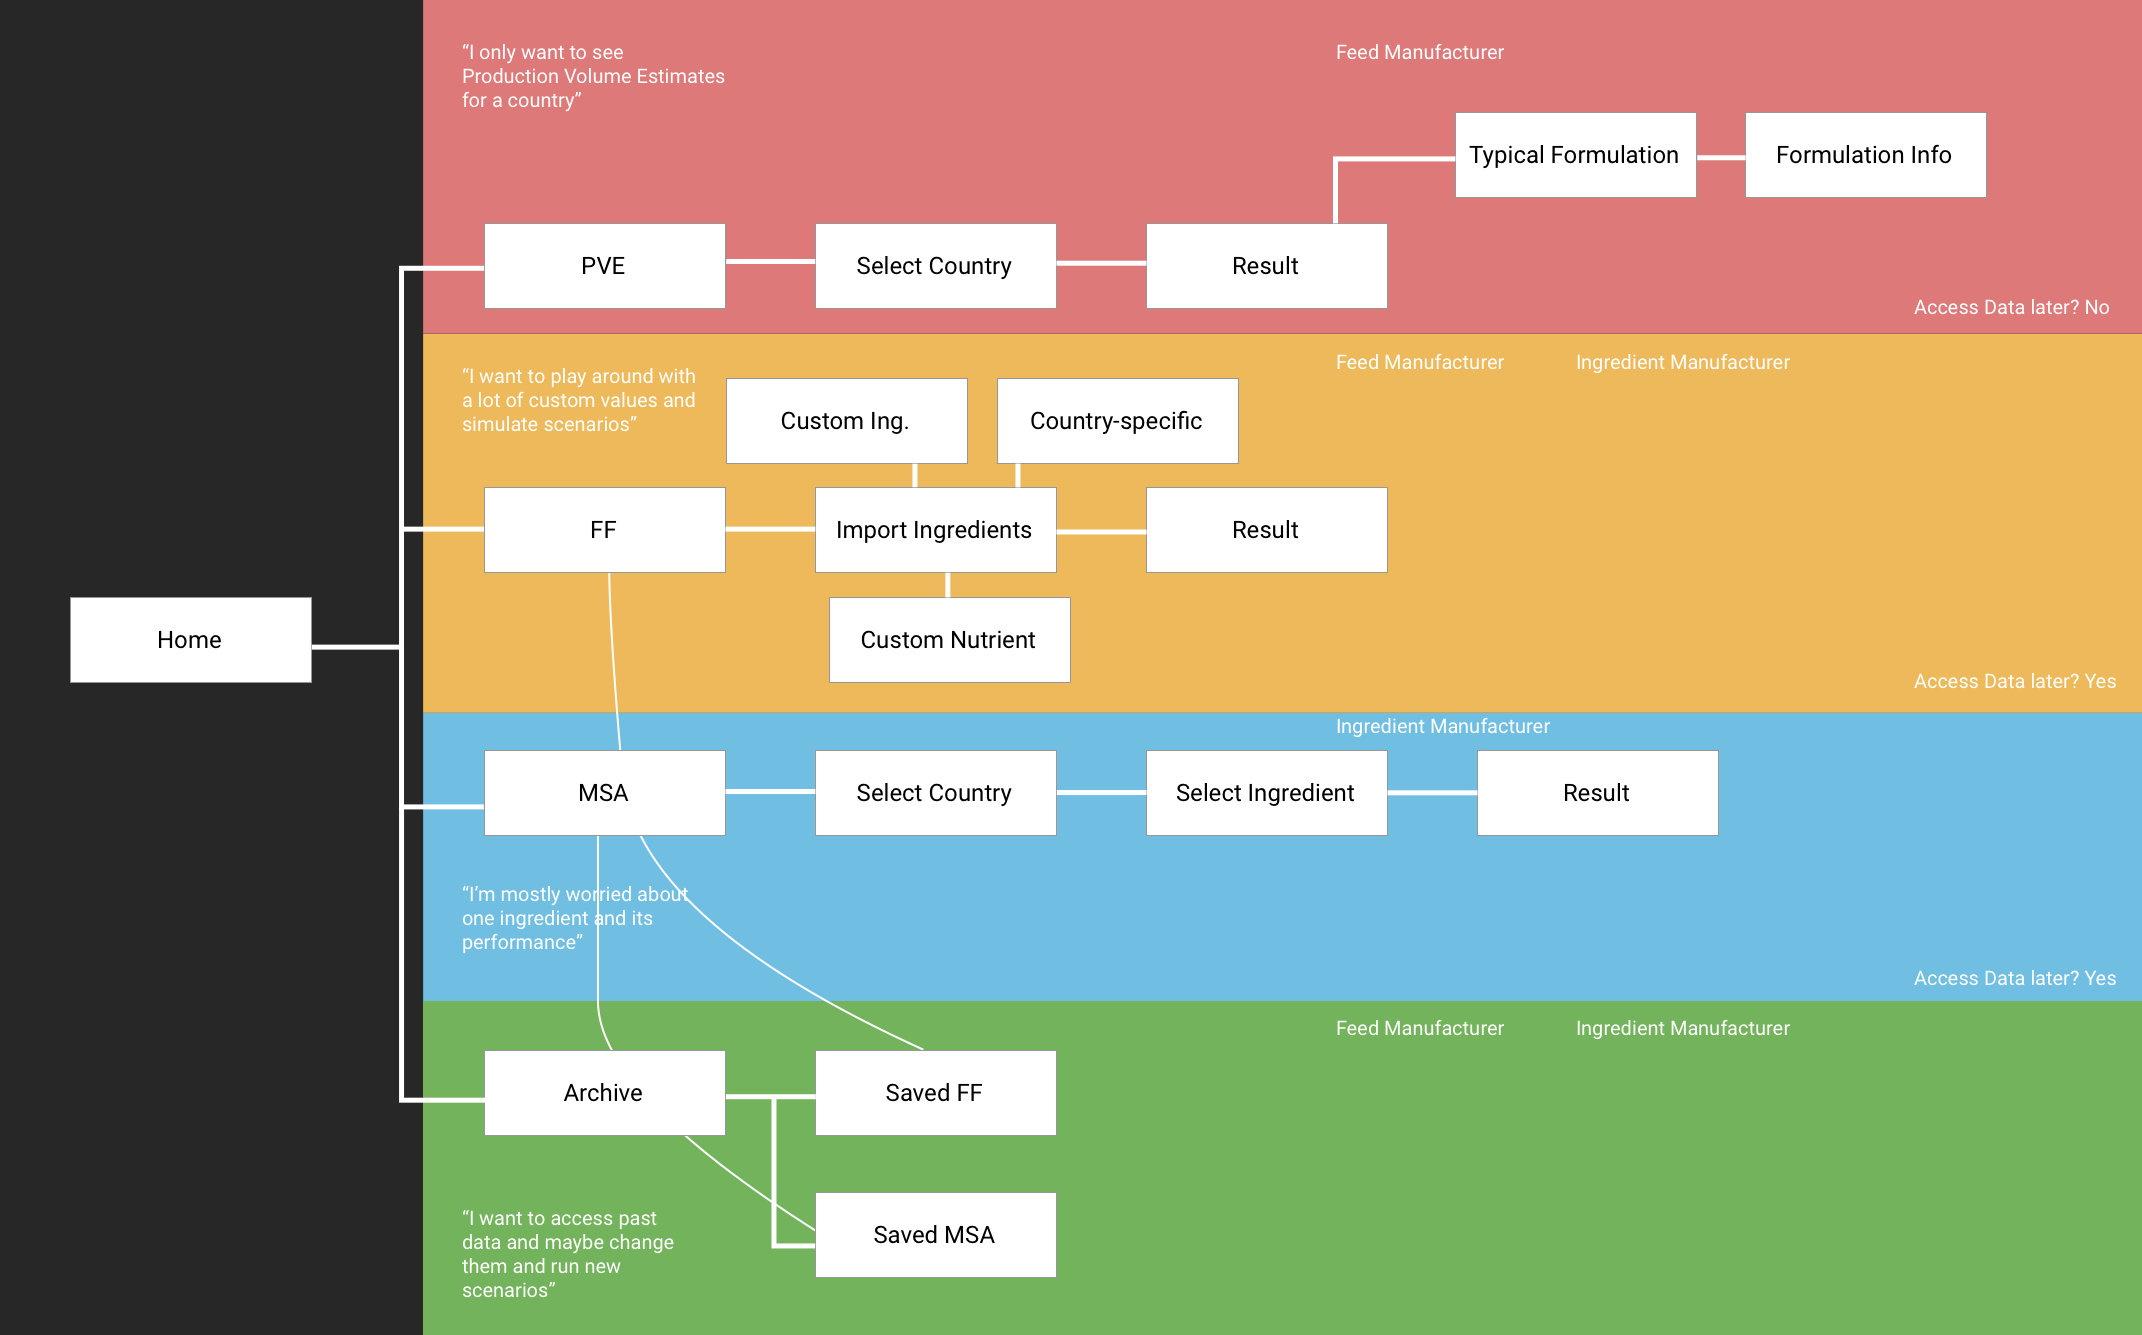
Based on our user personas, the following user journeys were created.
Market Size Analysis
To Address Jane’s pain points, we created the Market Size Analysis feature. The Market Size Analysis feature allows the user to select their custom ingredients and get a bird’s eye view of how their ingredient will fit in with the formulations.
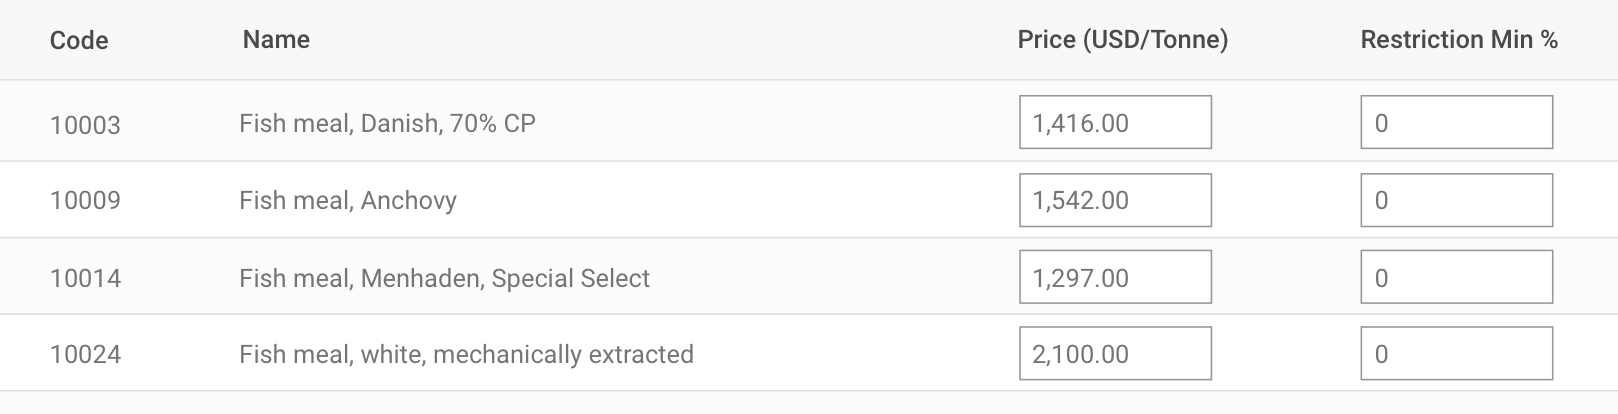
MSA - Ingredient list page
We have a horizontal tab system to show the Ingredients, Nutritional Specifications, and Group Constraints. On the left, we also have a vertical tab system to show the list of species available. This list was around 30 entries in the worst-case scenario, and therefore we decided to place them vertically to allow room for more tabs without horizontal scrolling. The selected ingredient is pinned to the top with some highlighting for clarity. The CTA at the bottom indicates what the user has to do after finishing up the work on this page.

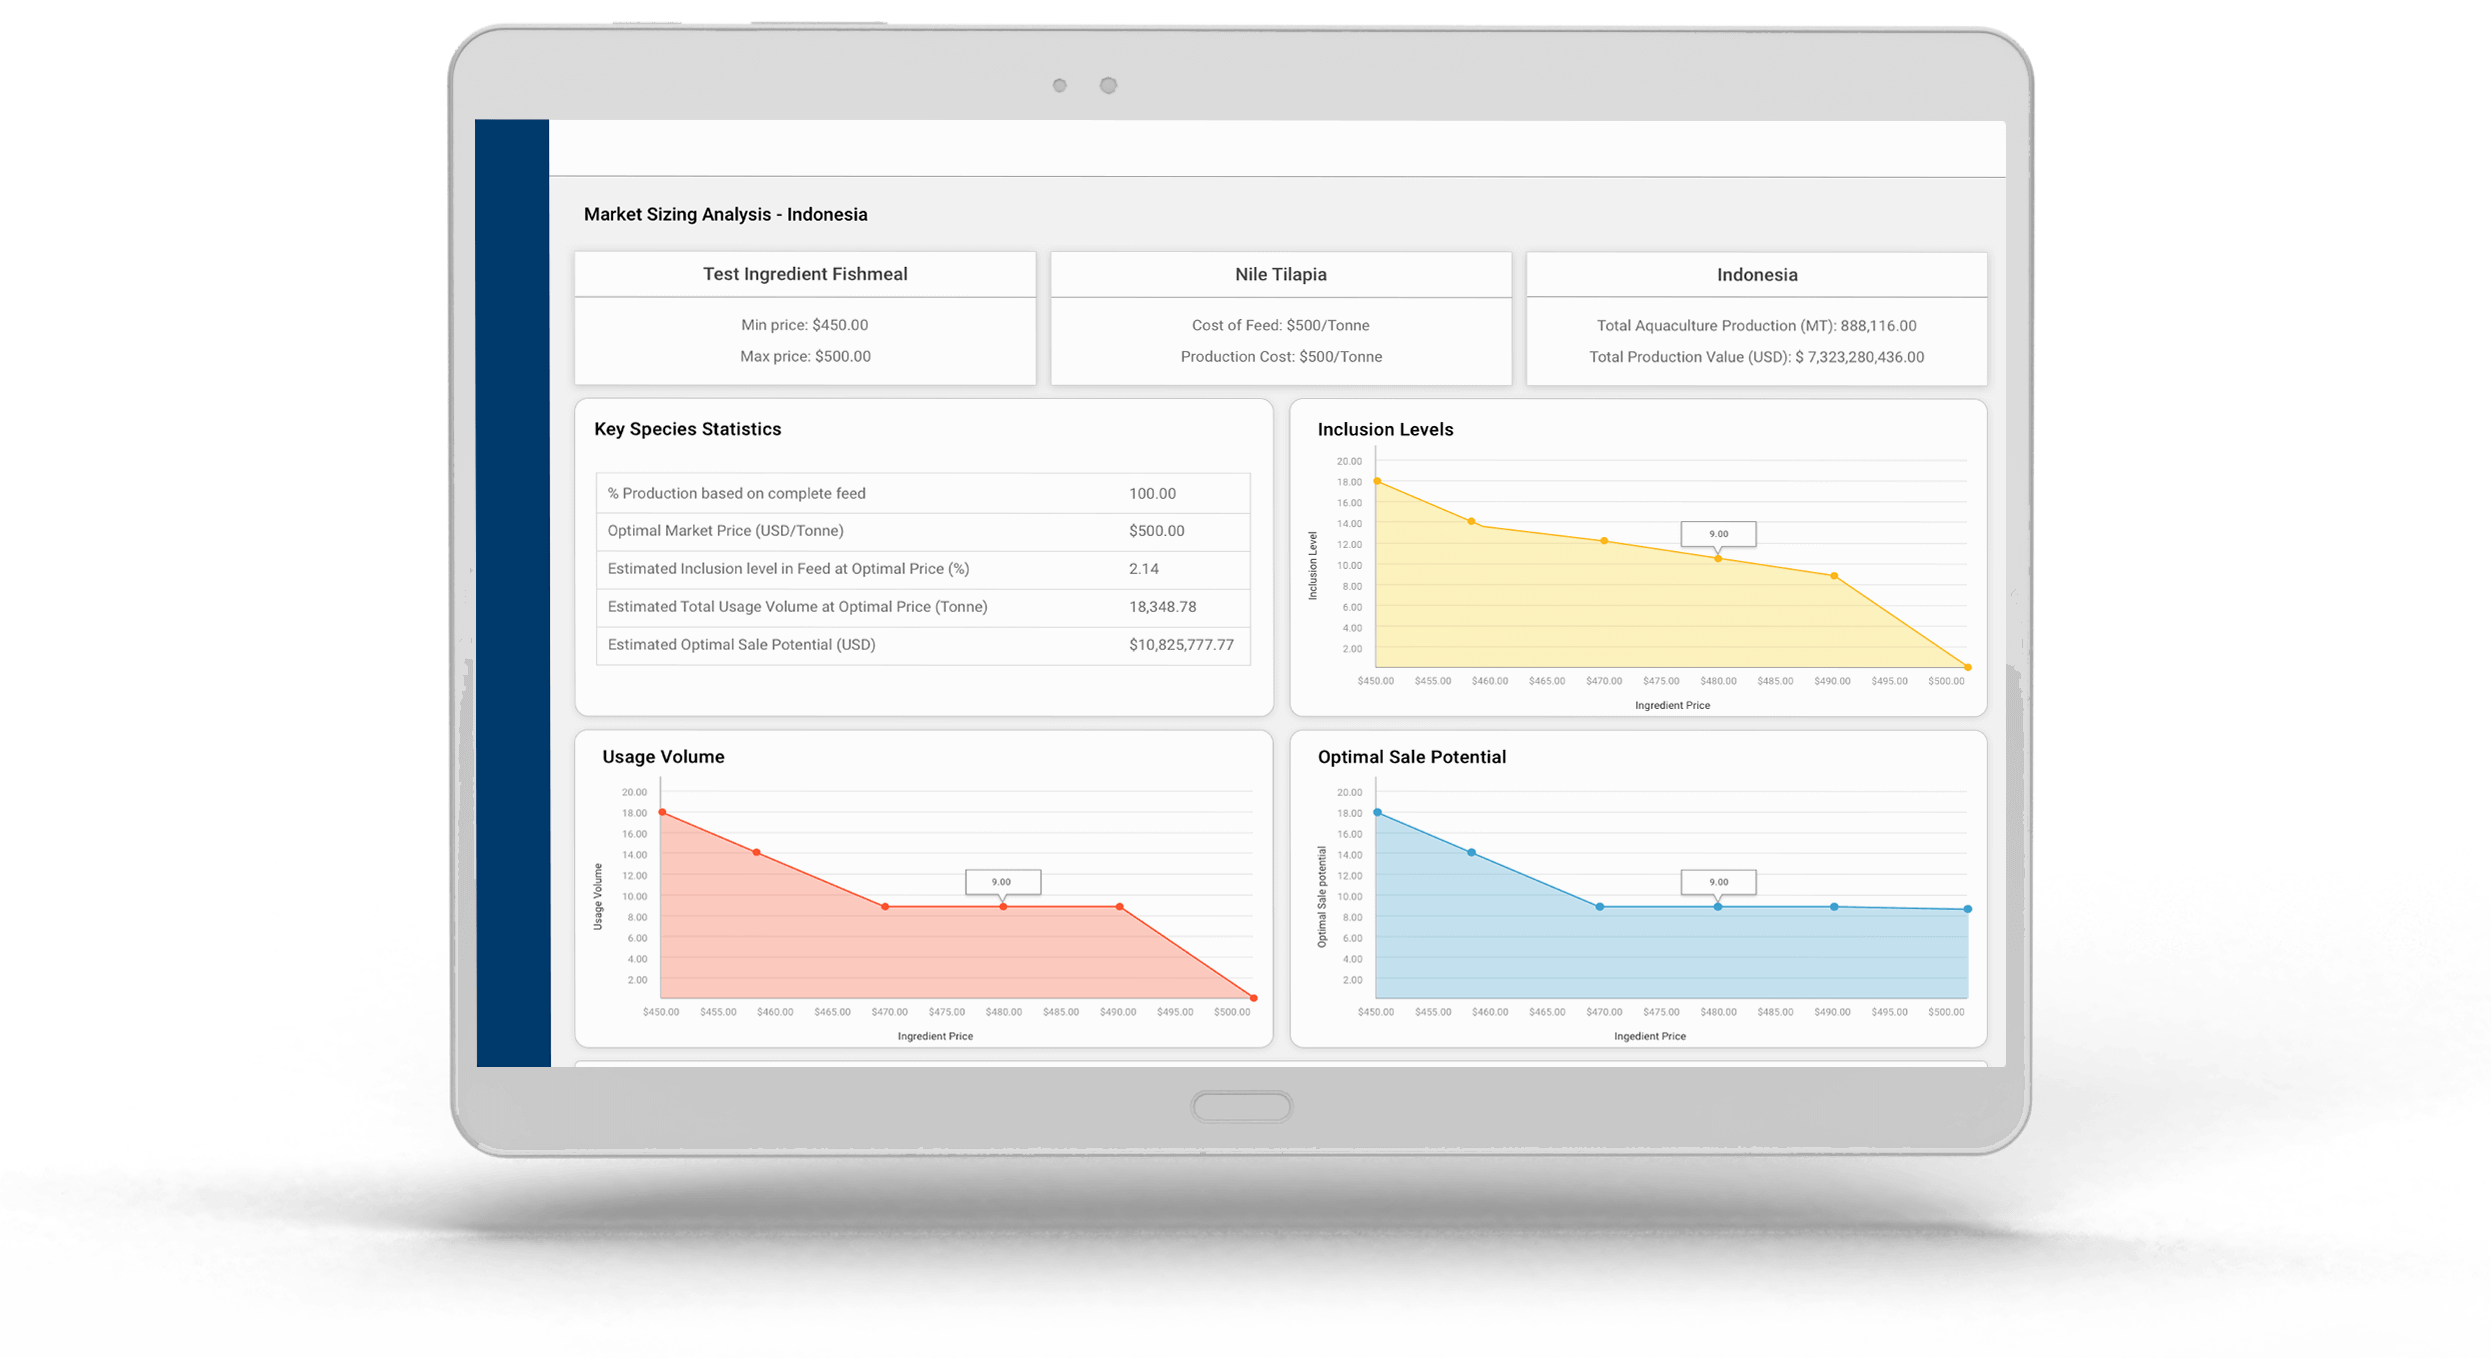
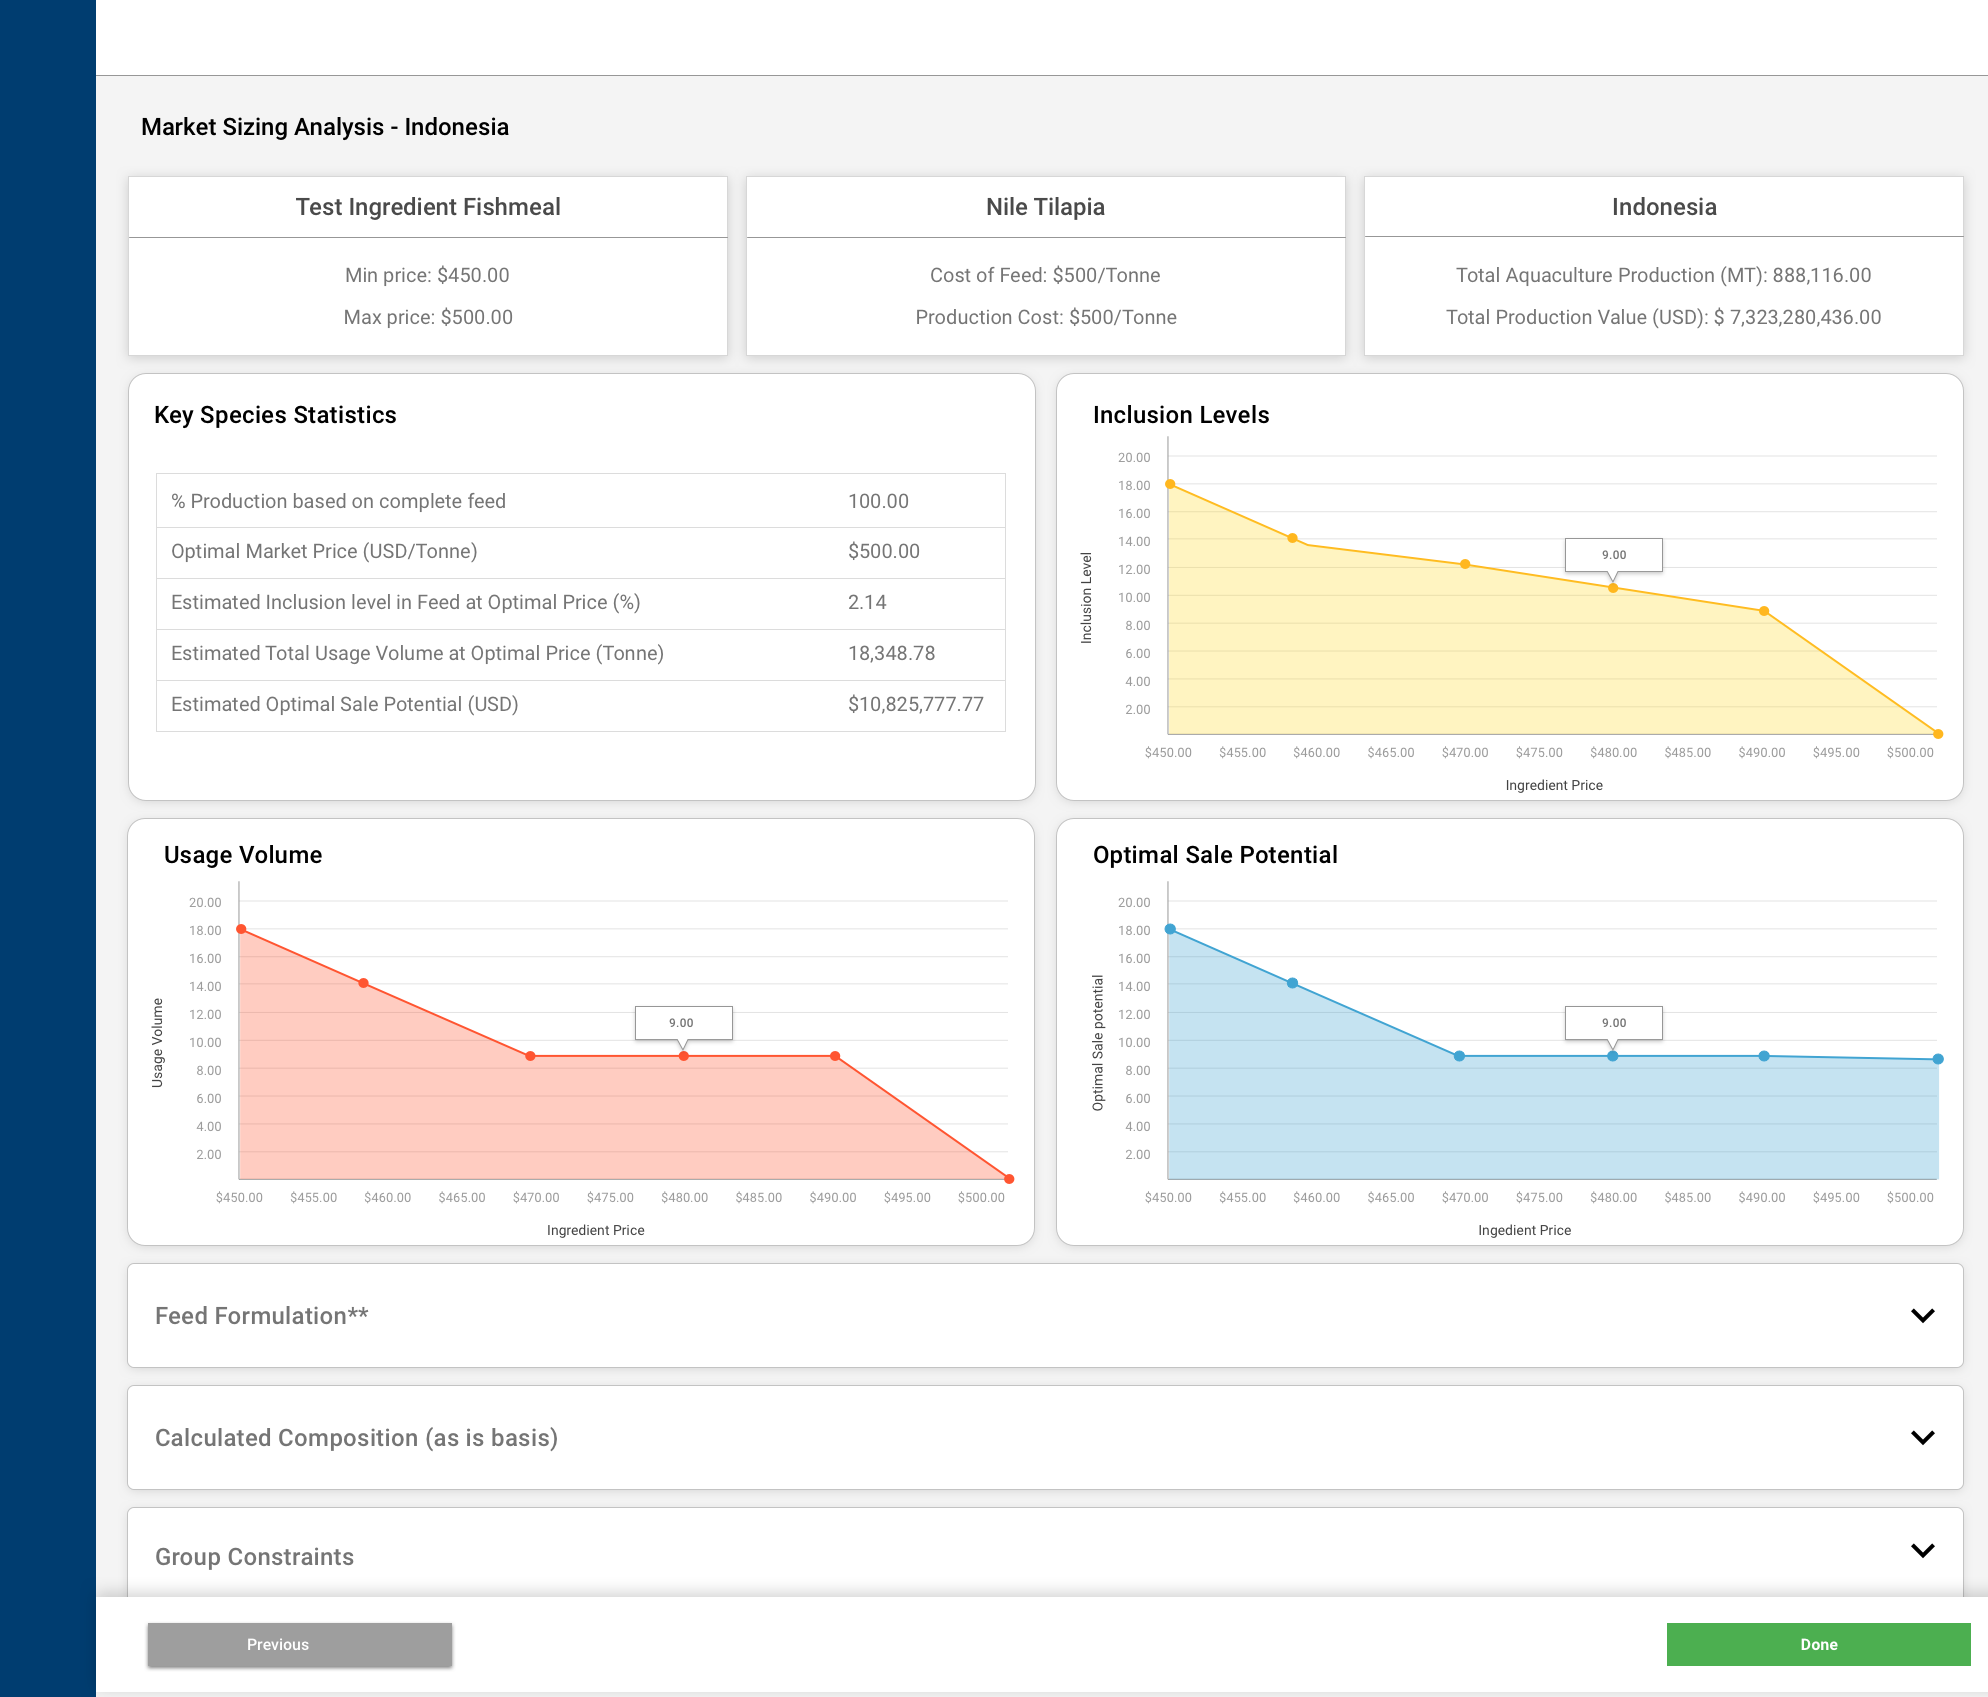
MSA - Results page
Market Sizing Analysis is ingredient specific, species specific, and country specific. Therefore, we placed these three key metrics in card form at the top, with some additional metrics below. Key Species Statistics, Inclusion levels, Usage Volume, and Optimal Sale Potential are all important results for the user which are placed below the key metrics. Some users also like to see their ingredient in a typical feed formulation, so some formulation-related tables are placed below, but collapsed by default.
Feed Formulation Flow
To address John’s user flow, we created the Feed Formulation Feature. The feed formulation feature has one key feature: Customizability. We have allowed the user to customize the ingredients by making all the values editable, as well as allowing the user to add custom nutrients and import ingredients.
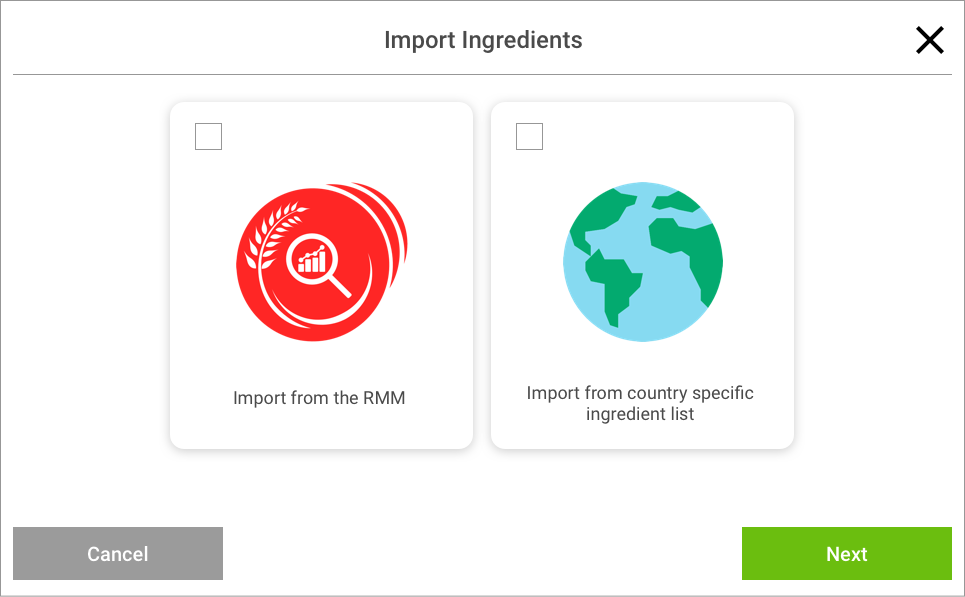
Import Ingredient Function
When importing ingredients, the user can either choose to select ingredients from their custom list (using another tool from the suite called the Raw Material Map), and/or from a country specific list stored in the FFT. Therefore, this format allows the user to select one or both of these options and add the ingredients. Additionally, we also allowed the users to play around with the inclusion levels on the app itself.
Production Volume Estimates
Users like James prefer to have a quick overview of the production of a certain feed in a certain country to determine how their feed ingredient would fit in. To handle their use case, we developed our Production Volume Estimates flow.
The flow requires only one click, where the user selects the country, and the following page is generated.

Constraints
Due to the urgency of the deliverable, our team decided to design this tool strictly under the limitations of Vuetify (A Vue.js material design component framework) to keep the development times reasonable. As the lead designer, I went through the Vuetify library to determine which components match our requirements the most.
We also had limited resources when it came to the developers, as our dev team only consisted of two developers. Due to this, I consistently held meetings with them to determine what I can do as the designer to cut their development time. As a result, most custom styling was eliminated.
Prototyping
Figma was used as our key prototyping and collaboration tool in showing the design to the client for feedback. We trained the members of the science team to edit the values on the mockups to ensure that the clients see realistic values on the tables.
FFT is a part of AquaOP Feed, meaning that the start of the flow is from the app homepage. For this iteration, we did not have to design this page, so we needed a way to ensure that we have a way to go back to the beginning of the flow. Therefore, we added some additional navigation buttons to go back and forth inside the flow to pages that are outside of this feature. However, these buttons can be confused as buttons that will actually be present in the product by the stakeholders. So, we decided to make them look extremely different to the rest of the visual design and ugly as possible!
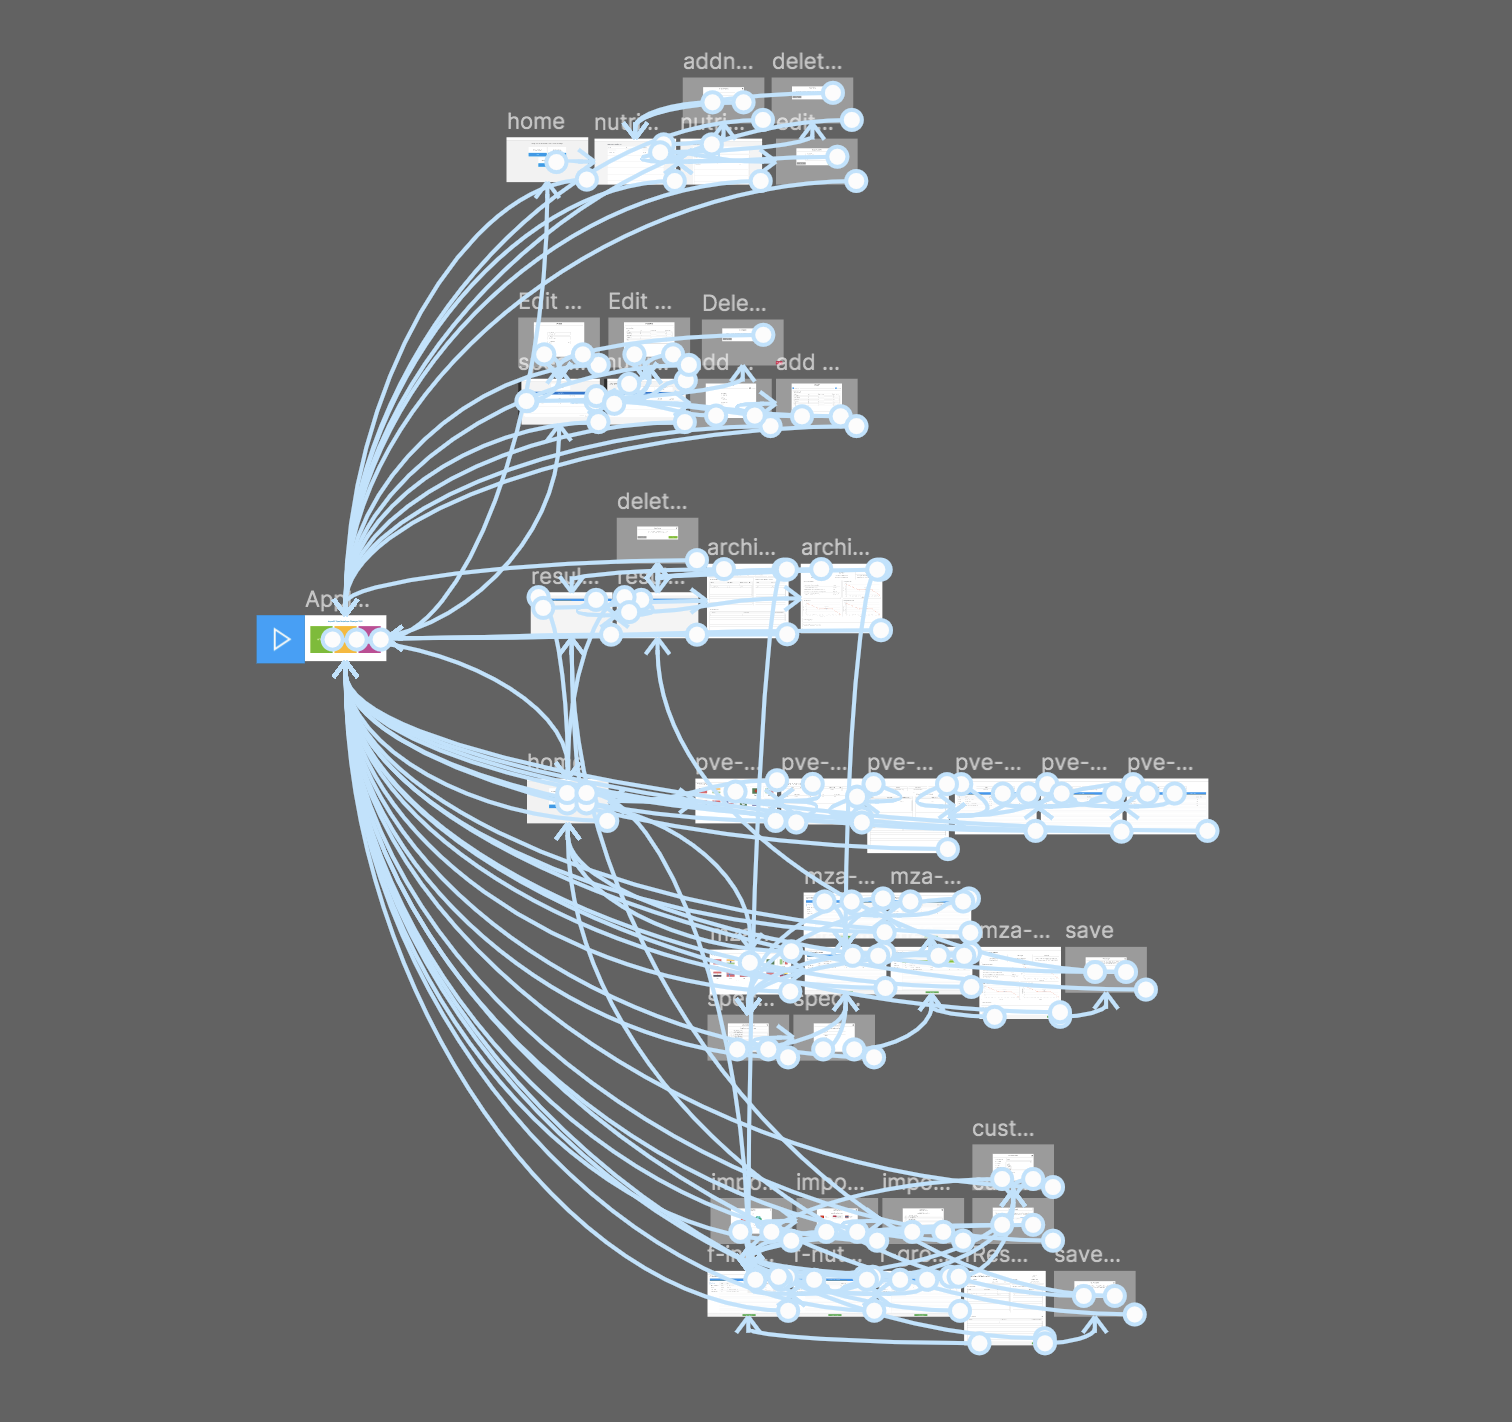
This is how our prototype was connected at the end :)
Conclusion
Aquafeed production is not an industry that I was familiar with. As a result, I worked with a lot of Aquaculture nutritionists to come up with the design.
It was rewarding to learn how Aquafeed is manufactured and how much thought is put into it. It makes me appreciate the seafood I eat and it gives me a great experience in designing something for a subject I’m unfamiliar with.
© 2021 Supul Amarakoon


